This material has been adapted from material by Fergus Cooper and others from the "Essential Mathematics" module at the Doctoral Training Centre, University of Oxford.
This course material was developed as part of UNIVERSE-HPC, which is funded through the SPF ExCALIBUR programme under grant number EP/W035731/1
Differential equations 3
Learning outcomes
Be able to find the steady-state solution of a differential equation
Be able to decide whether a steady state is stable or unstable
Be able to write down differential equations for chemical reactions using the law of mass action
Be able to use Euler's method to numerically solve differential equations
YouTube lecture recording from October 2020
A recording of this lecture from October 2020; the material has changed a little since.
Why steady states?
Often we don't need the full solution of a differential equation: we want to know where the system ends up, and whether it goes back there if something nudges it.
These long-run states are the steady states, and we can find them, and decide whether they are stable, without solving the equation.
In this lecture we find the steady states of models from biology and chemistry, written down using the law of mass action.
Steady-state solutions
It is often useful to find the steady state of a system described by ordinary differential equations.
This occurs when all rates (i.e. derivatives) are zero.
A steady state may be stable or unstable, depending on whether or not small deviations from the steady state tend to be corrected or amplified.
We can evaluate the stability of a steady state by considering the sign of the derivative nearby.
Example 1: radioactive decay
Recall the radioactive decay equation
dtdN=−λN.
We can solve it numerically, as in lecture 9:
import numpy as np
from scipy.integrate import solve_ivp
lam =1.0N0 =1.0t = np.linspace(0,6,100)defdNdt(t, N):return-lam * N
solution = solve_ivp(dNdt,[0,6],[N0], t_eval=t)N = solution.y[0]
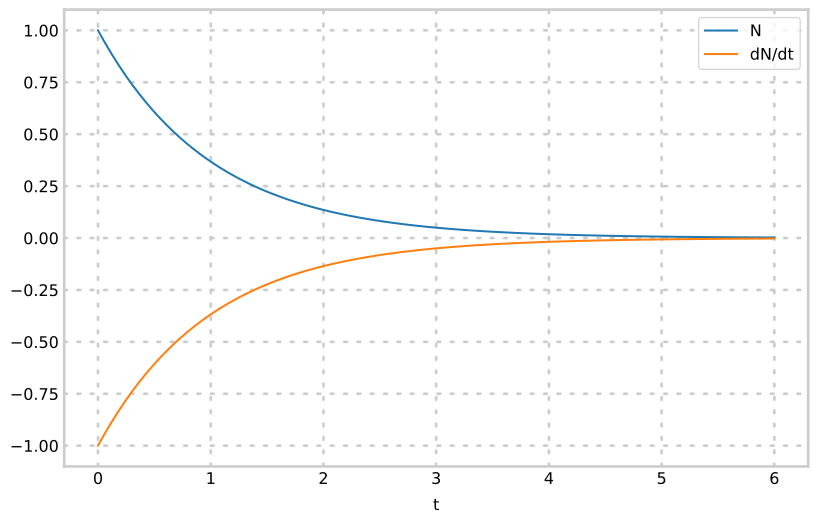
Let us examine a plot of the solution, N, and the gradient dN/dt as functions of time:
Here the steady state occurs when N=0, and is 'reached' after infinite time.
If N moves away from 0, then dN/dt=−λN has the opposite sign to N: negative when N is positive, and positive when N is negative.
So N always moves back towards 0, and the steady state is stable.
Example 2: production and degradation of a protein
Radioactive decay only loses N, but most quantities in biology are also produced.
Consider a simple model of the production and degradation of a protein S, with concentration s=[S]:
v1Sv2
where v1 and v2 are the rates of production and degradation.
We can represent the change in concentration of the protein by
dtds=v1−v2
so the steady state occurs when v1=v2.
To go further, we need to know how v1 and v2 depend on the concentrations.
Chemical reactions to equations: mass action
The law of mass action tells us how to write down the rates of reactions.
Under the law of mass action, we assume that:
chemical reactions have uniform mixing
rates are proportional to the product of the concentrations of the reactants
predator/prey interactions, and epidemics, have similar rules
Let us look at some examples:
A and B produce C. The reaction is governed by A meeting B:
A+Bk→C
Then we get the following differential equations:
dtd[A]dtd[B]dtd[C]=−k[A][B]=−k[A][B]=k[A][B]
Predation of R by W
R+Wk→W
Gives the following differential equation:
dtdR=−kRW
Constant production (zeroth order)
0k→A
Gives the following differential equation:
dtd[A]=k
Degradation/death
Ck→0
Gives the following differential equation:
dtd[C]=−k[C]
Steady states of reaction models
Example 2, continued: production and degradation under mass action
Back to our protein: with constant production and degradation,
k1Sk2
mass action gives v1=k1 and v2=k2s, so the equation is
dtds=k1−k2s.
The steady state is given by s=k1/k2, and it is stable.
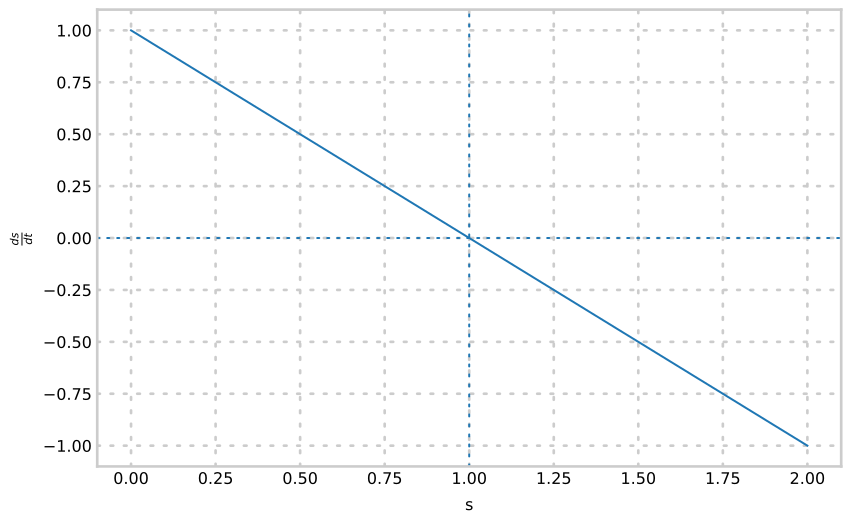
Here is a plot of ds/dt against s for k1=k2=1, so that the steady state is at s=1:
We can see that it is stable by examining the graph:
If we move to the left of s=1, the gradient is positive, so we move back towards s=1
If we move to the right of s=1, the gradient is negative, so we, again, move back towards s=1
The arrows on the s axis show which way s moves.
We can solve the differential equation by separation of variables:
If the initial concentration of S is s0, then s0=B+k1/k2, so B=s0−k1/k2 and
s(t)=s0e−k2t+k2k1(1−e−k2t)
Thus, the concentration of S relaxes exponentially to the steady state, no matter the initial condition.
Here it is for k1=k2=1, from several initial concentrations:
Example 3: positive feedback
To understand different possibilities for these steady states, let us suppose instead that S enhances its own production (positive feedback) and the degradation rate is nonlinear.
If we were to have the following form for v1 and v2:
v1=k1s
v2=k2s2
then:
dtds=k1s−k2s2
This system will be at steady state when k1s=k2s2, i.e.
s=0 or
s=k1/k2
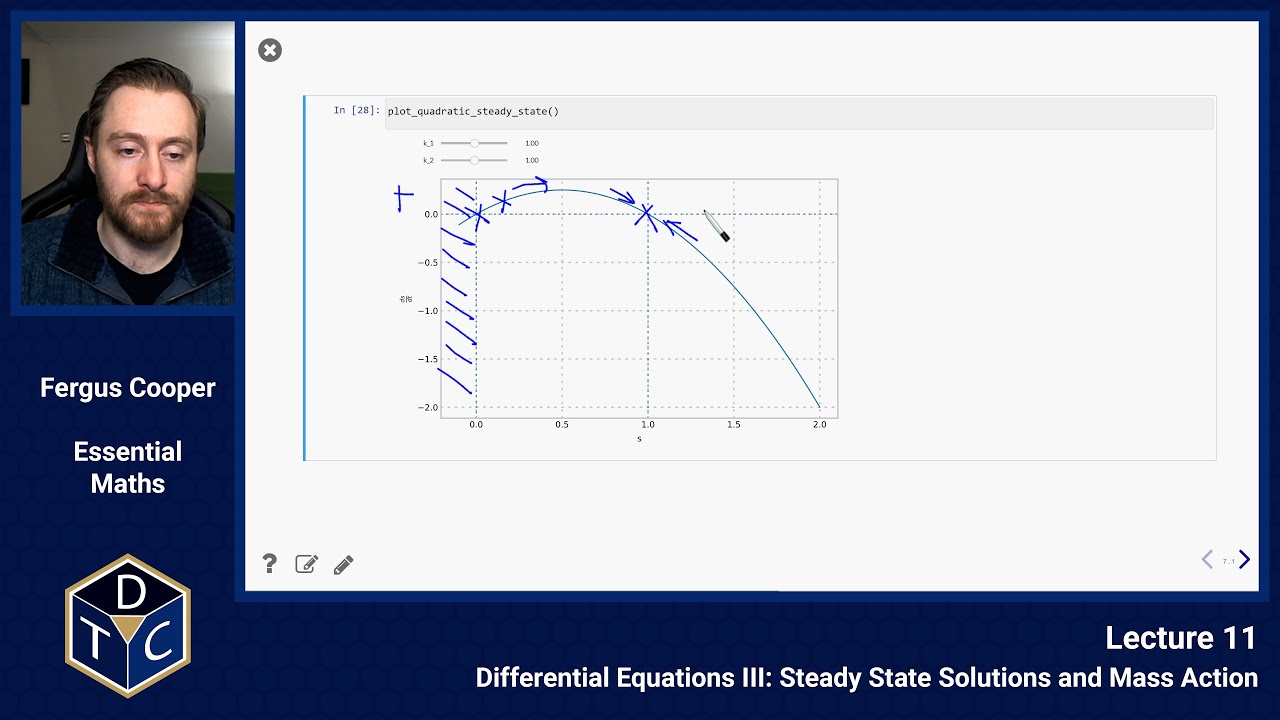
We can plot ds/dt versus s to see if they are stable or unstable.
Here, k1=k2=1:
The local behaviour near the fixed point at s=1 is the same as in the previous plot, so we can immediately see that it is a stable steady state.
The local behaviour near the fixed point at s=0 is the opposite: moving one way or the other, the gradient will take s even further away.
Non-graphical method
Let us investigate this same behaviour in a more rigorous manner.
dtds=k1s−k2s2
When s is small (and positive, since it is a concentration) s≫s2 so the derivative k1s−k2s2 will be positive, making s=0 an unstable steady state.
For the other steady state, consider small deviations by ε from the steady state, e.g. s=k1/k2+ε.
For small ε, ε2 is much smaller than ε, so ds/dt≈−k1ε, which has the opposite sign to ε.
So s moves back towards the steady state, and it is stable.
The slope at a steady state
The non-graphical method works for any equation of the form ds/dt=f(s).
Suppose s∗ is a steady state, so that f(s∗)=0.
Close to s∗, the curve of f is close to its tangent:
dtds=f(s)≈f′(s∗)(s−s∗)
If f′(s∗)<0, then ds/dt has the opposite sign to s−s∗, so s moves back: the steady state is stable.
If f′(s∗)>0, then s moves away: it is unstable.
For example, for positive feedback, f′(s)=k1−2k2s, so f′(0)=k1>0 (unstable) and f′(k1/k2)=−k1<0 (stable).
Example 4: the logistic equation
The growth of a cell colony can be modelled by the logistic equation
dtdN=rN(1−KN)
where N(t) is the number of cells at time t, and r and K are constant parameters (both positive).
Try finding the steady states of the logistic equation, and deciding whether each one is stable, before reading on.
The steady state for the system, or equilibrium population size, occurs when the growth rate is zero, i.e.
dtdN=0⇒rN=KrN2⇒N=0 or N=K.
This is positive feedback with k1=r and k2=r/K: the same equation as the growing leaf in lecture 10, and the logistic model of lecture 3.
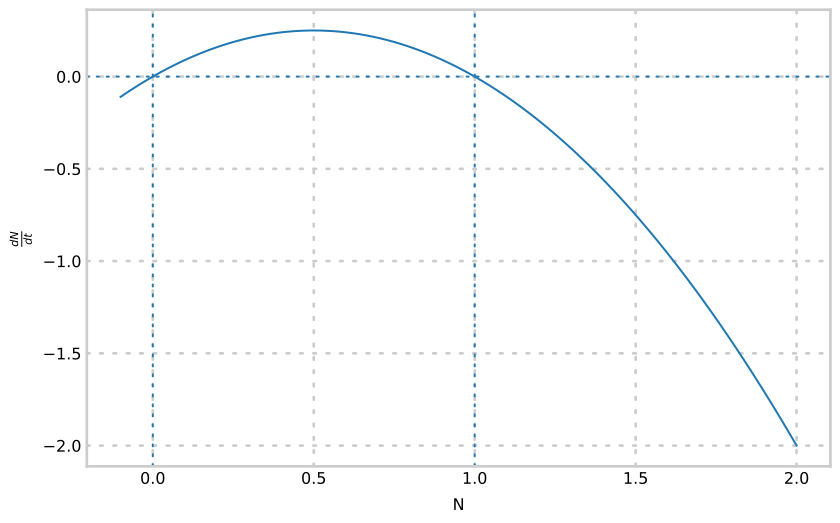
Here is a plot, for r=K=1:
For small positive N, rN>0 and N<K so dN/dt>0 and the population size will increase, meaning that N=0 is an unstable steady state.
In fact the growth rate is positive for 0<N<K and negative for N>K, making N=K a stable steady state.
We can solve the differential equation to examine the transient behaviour, that is, how the population approaches K.
It is lecture 10's leaf equation with k1=r and k2=r/K, so the same partial fractions give
N=1+(r/K)ert+drert+d
where ed=N0/(r−rN0/K), from the initial condition N(0)=N0.
Simplifying,
N(t)=K+N0(ert−1)KN0ert.
Here it is for r=K=1, from initial population sizes below and above K:
Solving numerically: a recap
In lecture 9 we solved dy/dt=f(t,y) numerically with Euler's method.
From y0 at t0, we take steps of size h along the tangent:
yn+1=yn+hf(tn,yn)
The smaller the step, the more accurate the answer, but the more steps we need.
Introductory problem 2 below works through Euler's method by hand and in Python.
In practice we use SciPy's solve_ivp, as we have throughout these lectures, which uses a more sophisticated method and chooses the step size for us.
Summary of first order differential equations
To solve a differential equation:
Calculate the general solution: try to write it as a separable equation first.
Other methods exist, such as integrating factors (see Extension problems 2).
The general solution includes an arbitrary constant, which we can find from the initial condition (if we are given one).
Check the solution numerically with Python, or solve numerically if we can't solve by hand.
To find steady state (equilibrium) solutions, find points where all (first) derivatives are zero.
To determine the stability of these steady states, look at the sign of the first derivative in the vicinity of the steady state.
You can sketch the first derivative, or use Python to help with this.
Introductory problems
For more practice, an AI tool can write new problems like the ones below.
Ask it for problems of the same type and difficulty, or for problems set in your own field.
For example, you could ask it to "write five biochemistry problems on steady states and their stability, at the level of these ones".
Work them on paper first, then ask the tool to check your answers and to explain any step you are unsure of.
Introductory problems 1
Determine the steady states and their stabilities, for each of the following:
dx/dt=x(a−x), where a is a positive constant
dx/dt=x2−4x+3
dx/dt=ex(x2−1)
dN/dt=r0N(1−N/K), where r0<0 and r0, K are constants
dx/dt=Ax/(h+x), where A and h are negative constants
In each case, the steady states are where the right-hand side, f, is zero.
To find their stability, we look at the gradient of f at each steady state.
If it is negative, f goes from positive to negative as we pass through the steady state, so nearby solutions move back towards it, and the steady state is stable.
If it is positive, nearby solutions move away, and the steady state is unstable.
f(x)=x(a−x) is zero at x=0 and x=a.
Its gradient is f′(x)=a−2x.
At x=0, f′(0)=a>0, so x=0 is unstable.
At x=a, f′(a)=−a<0, so x=a is stable.
f(x)=x2−4x+3=(x−1)(x−3) is zero at x=1 and x=3.
Its gradient is f′(x)=2x−4.
At x=1, f′(1)=−2<0, so x=1 is stable.
At x=3, f′(3)=2>0, so x=3 is unstable.
ex is never zero, so f(x)=ex(x2−1) is zero only at x=±1.
By the product rule, f′(x)=ex(x2−1)+2xex=ex(x2+2x−1).
At x=1, f′(1)=2e>0, so x=1 is unstable.
At x=−1, f′(−1)=−2e−1<0, so x=−1 is stable.
f(N)=r0N(1−N/K) is zero at N=0 and N=K.
Its gradient is f′(N)=r0(1−2N/K).
At N=0, f′(0)=r0<0, so N=0 is stable.
At N=K, f′(K)=−r0>0, so N=K is unstable.
This is the logistic equation with a negative growth rate, so the stabilities are the other way round from the usual logistic equation.
f(x)=Ax/(h+x) is zero only at x=0.
By the quotient rule,
f′(x)=(h+x)2A(h+x)−Ax=(h+x)2Ah
At x=0, f′(0)=A/h, which is positive because A and h are both negative.
So, x=0 is unstable.
(Note, f is not defined at x=−h, which is a positive value of x.)
Introductory problems 2
Consider the differential equation
dtdy=−2ywithy(0)=1.
Solve the equation exactly, by separation of variables.
Use Euler's method by hand, with a step size of δt=0.1, to estimate y(0.1), y(0.2) and y(0.3).
Compare your estimate of y(0.3) with the exact value.
Write a Python function that uses Euler's method to estimate y(1).
Find the error in your estimate for δt=0.1 and for δt=0.05.
What happens to the error when the step size is halved?
Separating the variables,
∫ydy=∫−2dt⇒lny=−2t+c
and y(0)=1 gives c=0, so y=e−2t.
Each step of Euler's method is yn+1=yn+f(yn,tn)δt, where here f(y,t)=−2y.
So, each step multiplies y by 1−2δt=0.8:
The exact value is y(0.3)=e−0.6≈0.5488, so the estimate is about 0.037 too small.
Euler's method uses the gradient at the start of each step, and here the gradient gets less steep as y decreases, so each step goes down a little too far.
In Python:
import numpy as np
defeuler(f, y0, t0, t_end, dt): n_steps =round((t_end - t0)/ dt) y = y0
t = t0
for _ inrange(n_steps): y = y + f(y, t)* dt
t = t + dt
return y
deff(y, t):return-2* y
exact = np.exp(-2)for dt in[0.1,0.05]: approx = euler(f,1,0,1, dt)print(f"dt = {dt}: y(1) = {approx:.6f}, error = {exact - approx:.6f}")
Halving the step size roughly halves the error.
This means that, to make the error 10 times smaller, we need 10 times as many steps.
This is why solve_ivp uses more sophisticated methods.
Main problems
Main problems 1
Not all chemical systems relax exponentially to steady state.
Consider the bimolecular decay reaction
A+A⟶k
Assuming k is a mass action constant, form and solve a differential equation representing the change in concentration of A.
If a(0)=a0 you should get
a(t)=2kt+a011.
Under mass action, the reaction happens at a rate ka⋅a=ka2.
Each reaction uses up two molecules of A, so
dtda=−2ka2
Separate the variables and integrate:
∫a2da=−∫2kdtso−a1=−2kt+C
At t=0, a=a0, so C=−1/a0.
This means that
a1=2kt+a01soa(t)=2kt+a011
This does not decay exponentially.
For large t, a(t)≈1/(2kt), which falls much more slowly than an exponential.
Main problems 2
The SIS model is an appropriate model for diseases that mutate quickly and can therefore infect people multiple times, such as the common cold or sexually transmitted infections like gonorrhea and chlamydia.
In the model, individuals are 'susceptible' until they are 'infected', and then they return to being 'susceptible' again.
Infection requires the interaction of susceptible individuals with infected individuals and therefore follows the law of mass action, whereas the rate at which an individual becomes susceptible again after infection is constant.
Let S and I be the proportions of the population that are susceptible and infected.
If infection happens at rate β and recovery happens at rate γ, write down differential equations for S and I.
Noting that S and I are proportions of the population, which is assumed constant, reduce the system to a single differential equation in terms of I.
In other words, write down a single equation, involving just I and its derivative.
Find both steady states of I. Under what conditions on β and γ are each attainable?
Without solving the differential equation, sketch the behaviour of S and I over time, starting with a small quantity of infected individuals.
Illustrate how both steady states may be achieved.
Infection needs a susceptible individual to meet an infected one, so by mass action it happens at rate βSI.
Recovery happens at rate γI.
Infection moves individuals from S to I, and recovery moves them back:
dtdS=−βSI+γI,dtdI=βSI−γI
The proportions add up to one, S+I=1, so S=1−I and
dtdI=βI(1−I)−γI
Write f(I)=βI(1−I)−γI=I(β−γ−βI).
This is zero at I=0 and at I=1−γ/β.
Its gradient is f′(I)=β−γ−2βI.
At I=0, f′(0)=β−γ.
So, the disease dies out (this steady state is stable) when β<γ.
At I=1−γ/β, f′=γ−β.
So, this steady state is stable when β>γ, which is also when it is positive and so makes sense as a proportion.
In other words, the disease persists when people are infected faster than they recover.
Starting with a small I (and so S close to 1):
If β>γ, I grows, slowly at first, then faster, then levels off at 1−γ/β, in an S-shaped curve.
S=1−I falls in a mirror image, levelling off at γ/β.
If β<γ, I decays towards zero, and S rises towards 1.
We can check the sketch by solving the equation numerically, for example with β=0.5, γ=0.2 and with β=0.2, γ=0.5:
import numpy as np
from scipy.integrate import solve_ivp
from matplotlib import pyplot as plt
t = np.linspace(0,50,200)for beta, gamma in[(0.5,0.2),(0.2,0.5)]: sol = solve_ivp(lambda t, I: beta * I *(1- I)- gamma * I,(0,50),[0.01], t_eval=t) plt.plot(t, sol.y[0], label=f'I, beta = {beta}, gamma = {gamma}') plt.plot(t,1- sol.y[0],'--', label=f'S, beta = {beta}, gamma = {gamma}')plt.xlabel('t')plt.ylabel('proportion')plt.legend()
Main problems 3
Consider a closed reaction system consisting of a single reversible reaction:
Akb⇌kfB
where kf and kb are mass action coefficients.
Formulate a pair of coupled differential equations for the change in concentration of A and B.
Noting that the total concentration T of reactants is constant (T=[A]+[B]), reduce the system of equations to a single differential equation.
In other words, write down a single equation, involving either just A and its derivative, or just B and its derivative.
Find the steady-state concentrations of A and B.
Solve the single differential equation to reveal the transient behaviour.
Sketch the behaviour for different illustrative initial conditions.
The forward reaction turns A into B at rate kf[A], and the backward reaction turns B into A at rate kb[B]:
Whatever the starting concentration, [A] relaxes exponentially to its steady state, from above if it starts above it, and from below if it starts below it.
The rate of approach is kf+kb, the sum of the two rate constants.
[B]=T−[A] does the opposite.
For example, with kf=2, kb=1 and T=1:
import numpy as np
from matplotlib import pyplot as plt
kf =2kb =1T =1A_ss = kb * T /(kf + kb)t = np.linspace(0,3,200)for A0 in[0,0.2,0.6,1]: plt.plot(t, A_ss +(A0 - A_ss)* np.exp(-(kf + kb)* t), label=f'[A](0) = {A0}')plt.xlabel('t')plt.ylabel('[A]')plt.legend()
Main problems 4
Consider the simple model
dtds=k−KM+sVmaxs
in which species s is produced at a fixed rate and consumed via Michaelis-Menten kinetics.
Find the steady state of s, and verify that it is stable for any non-negative parameter values, provided Vmax>k.
At steady state ds/dt=0, so
k=KM+sVmaxssokKM+ks=Vmaxssos∗=Vmax−kkKM
This is positive, and so makes sense as a concentration, only if Vmax>k.
(If Vmax≤k, production is faster than the enzyme can ever consume s, so s grows without limit.)
To check stability, write f(s)=k−Vmaxs/(KM+s).
By the quotient rule,
This is negative for every s≥0 when Vmax and KM are positive, so in particular f′(s∗)<0, and the steady state is stable.
In other words, below s∗ production beats consumption and s rises, and above s∗ consumption wins and s falls.
Main problems 5
Recall the simple model of the production and degradation of a protein from the lecture, shown by the reaction chain
⟶v1S⟶v2
where v1 and v2 are reaction rates rather than mass action coefficients.
Suppose v1=k1 and v2=k2s, as in the lecture.
Write down a differential equation describing the rate of change of S, and find the steady state concentration of S in terms of the two parameters k1 and k2 (i.e. the concentration at which the rate of change is zero).
At what rate is S being produced in steady state?
Now suppose that
v1=k0+k2+s2k1s2andv2=k3s
and take the parameter values to be k0=6/11, k1=60/11, k2=11, k3=1.
Determine the number of steady states and the type of each.
ds/dt=v1−v2=k1−k2s.
At steady state this is zero, so s∗=k1/k2.
In steady state, S is produced at rate v1=k1, which exactly balances its degradation, k2s∗=k1.
With the given values,
dtds=116+116011+s2s2−s
Put everything over the common denominator 11(11+s2):
So, there are three steady states, s=1, s=2 and s=3.
The denominator is always positive, so the sign of ds/dt is the sign of −(s−1)(s−2)(s−3):
s
s<1
1<s<2
2<s<3
s>3
ds/dt
+
-
+
-
Solutions move towards s=1 and s=3 from both sides, so these are stable.
They move away from s=2, so it is unstable.
This means that the system is bistable, settling at a low or a high level of S depending on whether it starts below or above s=2.
Extension problems
Extension problems 1
Various mathematical models have been proposed for the initial growth of solid tumours, and some are summarised in The Model Muddle: In Search of Tumor Growth Laws.
They are differential equations describing the rate of change of tumour volume V as a function of time t, for example:
dV(t)/dt=rV(t)
dV(t)/dt=rV(t)b
dV(t)/dt=r0e−ρtV(t)
Solve each equation both analytically and numerically, using Python.
As was done in Figure 1A in the paper, compare the behaviours of the different growth laws over a suitable time interval for an initially small tumour, again using Python.
With V in mm3 and t in days, take V(0)=1, r=0.1, b=2/3, r0=0.1 and ρ=0.02, and compare the laws over the first 100 days.
Each equation is separable.
∫dV/V=∫rdt gives lnV=rt+C, so
V(t)=V(0)ert
This is exponential growth, with no limit.
∫V−bdV=∫rdt gives V1−b/(1−b)=rt+C (for b=1), so
V(t)=(V(0)1−b+(1−b)rt)1/(1−b)
With b=2/3, this is V(t)=(V(0)1/3+rt/3)3, which grows like t3.
(One explanation for b=2/3 is that only the cells near the surface of the tumour divide, and the surface area grows like V2/3.)
∫dV/V=∫r0e−ρtdt gives lnV=−ρr0e−ρt+C.
At t=0, lnV(0)=−r0/ρ+C, so
V(t)=V(0)exp(ρr0(1−e−ρt))
This is the Gompertz law.
The growth rate decays over time, so the volume levels off at V(0)er0/ρ.
To solve them numerically, we use solve_ivp, and compare with the analytic solutions (dotted lines) on a logarithmic V axis:
import numpy as np
from scipy.integrate import solve_ivp
from matplotlib import pyplot as plt
V0 =1r =0.1b =2/3r0 =0.1rho =0.02t = np.linspace(0,100,201)# Each model: its right-hand side dV/dt, and its analytic solutionmodels ={'exponential':(lambda t, V: r * V, V0 * np.exp(r * t)),'power law':(lambda t, V: r * V**b,(V0**(1- b)+(1- b)* r * t)**(1/(1- b))),'Gompertz':(lambda t, V: r0 * np.exp(-rho * t)* V, V0 * np.exp(r0 / rho *(1- np.exp(-rho * t)))),}for name,(dVdt, analytic)in models.items(): sol = solve_ivp(dVdt,(0,100),[V0], t_eval=t, rtol=1e-8)print(f'{name}: V(100) = {sol.y[0,-1]:.1f} (numerical), {analytic[-1]:.1f} (analytic)') plt.semilogy(t, sol.y[0], label=name) plt.semilogy(t, analytic,'k:')plt.xlabel('t (days)')plt.ylabel('V (mm$^3$)')plt.legend()
The numerical and analytic solutions agree.
All three laws start growing at the same rate, 0.1mm3 per day, and are hard to tell apart for the first few days.
After 100 days, though, the exponential law predicts a tumour of over 22,000 mm3, while the other two predict less than 100 mm3, and the Gompertz curve is levelling off (towards e5≈148mm3).
This is the kind of comparison shown in Figure 1A of the paper, where laws that look alike early on make very different predictions later.
Extension problems 2
The lecture does not cover integrating factors, so here is the method.
If an equation can be written in the form
dxdy+P(x)y=Q(x)
multiply both sides by the integrating factorI(x)=e∫P(x)dx.
Because dI/dx=P(x)I(x), the product rule shows that the left-hand side becomes dxd(I(x)y), so
I(x)y=∫I(x)Q(x)dx
Find the solution to the following differential equations subject to the specified boundary conditions, using integrating factors:
dy/dx+y/x=0withy(2)=2forx>0
dy/dx+(2x−1)y=0withy(1)=2
x3dy/dx+2y=e1/x2withy(1)=e
sec(x)dy/dx+y=1withy(0)=1
dy/dx+ytan(x)=cos(x)withy(0)=1for0≤x<π/2
P(x)=1/x, so I(x)=elnx=x (for x>0), and Q(x)=0:
dxd(xy)=0soxy=C
At x=2, y=2, so C=4, and y=4/x.
P(x)=2x−1, so I(x)=ex2−x, and Q(x)=0:
dxd(ex2−xy)=0soy=Cex−x2
At x=1, y=C=2, so y=2ex−x2.
(Parts 1. and 2. are also separable, and separating the variables gives the same answers.)
First divide by x3 to get the standard form:
dxdy+x32y=x3e1/x2
P(x)=2x−3, so ∫Pdx=−x−2 and I(x)=e−1/x2.
Then I(x)Q(x)=1/x3, so
e−1/x2y=∫x3dx=−2x21+C
At x=1, y=e, so 1=−1/2+C and C=3/2.
So,
y=e1/x2(23−2x21)
Multiply by cos(x) (since sec(x)=1/cos(x)) to get the standard form:
dxdy+cos(x)y=cos(x)
P(x)=cos(x), so I(x)=esin(x):
dxd(esin(x)y)=esin(x)cos(x)soesin(x)y=esin(x)+C
This gives y=1+Ce−sin(x).
At x=0, y=1+C=1, so C=0, and the solution is simply y=1.
(We could have spotted this: y=1 makes dy/dx=0, and then the equation holds.)
P(x)=tan(x), so ∫Pdx=−ln(cos(x)) (for 0≤x<π/2, where cos(x)>0) and I(x)=1/cos(x)=sec(x):
dxd(sec(x)y)=sec(x)cos(x)=1sosec(x)y=x+C
At x=0, y=1, so C=1, and y=(x+1)cos(x).
Extension problems 3
Consider the second order differential equation
dx2d2y+y=0
Show that y=Aez1x+Bez2x is a solution to this equation for some complex numbers z1, z2 and constants A, B (which may also be complex).
Recalling that any complex number z can be written as z=reiθ=r(cosθ+isinθ), what does this tell you about the nature of the solution?
If y(0)=1 and y(π/2)=2 what is the particular solution of the differential equation?
Try y=ezx.
Then d2y/dx2=z2ezx, so the equation becomes
z2ezx+ezx=(z2+1)ezx=0
ezx is never zero, so we need z2=−1, that is z1=i and z2=−i.
The equation is linear, so any combination y=Aeix+Be−ix is also a solution.
So, the solution is a combination of cosx and sinx, and oscillates with period 2π.
Writing C=A+B and D=i(A−B), the solution is y=Ccosx+Dsinx.
For y to be real, C and D must be real, which needs A and B to be complex conjugates of each other.