Fluorescence Extraction
Fluorescence extraction
The purpose of these functions are to
- Get the location (i.e. pixel map) of each cell as a distinct entity
- Obtain these locations across time
- Record the average intensity in the cytoplasm and nucleus for each pixel map and timepoint
N.B. I personally found the way that the LLM structured the code unhelpful for debugging, and rewrote the data structure to something that made more sense to me personally (this occurs in the worked solution after error 3) - you do not have to do this, but you might find it helps.
It also probably helps to reduce the number of images analysed (at least to start with), as you don't need to analyse every timepoint if the error is thrown at the first timepoint.
Getting started
Navigate to
Repressilator_tests/tests and verify that the test fails:python -m pytest fluorescence_extractor_test.py::test_track_cells
We're going to be making changes to the codebase, so it's worth making a separate branch first:
git checkout -b cell_tracking_fix
Now we can make changes to the tests and
repressilator_analysis module, and can choose to merge them back later. It's often worth being able to print test outputs, so you may like to add test_track_cells() to the end of fluorescence_extractor_test.py. You can then see the same test output by running:python fluorescence_extractor_test.py
The Test Functions
test_track_cells() calls three functions:image_loader.load_timeseries()
- Arguments: Location of intensity and phase directories
- Returns: Time of each image recording in minutes, list of extracted intensity images, list of extracted phase images
fluorescence_extraction.track_cells_across_time()
- Arguments:
- List of phase images provided by
load_timeseries - Minimum cell area in pixels (set at 5)
Returns Two arguments - the first is a dictionary where each key is a cell ID mapping to a list of tuples.
The first element of each tuple is the timepoint ID, the second the currently assigned cell_id and the third element is the x,y centroid position.
#arg1, "tracks" { # Dictionary "1": [ # track id (time1, current_id, (centre_x,centre_y)), # Tuple (time2, current_id, (centre_x,centre_y)), ], "2": [ #track_id (time1, current_id, (3.2, 5.7)), ... ], ... }
The second is a list of images with each cell mask given their own label
fluorescence_extraction.extract_nuclear_cytoplasmic()
- Arguments:
- An intensity image provided by
load_timeseries - A labelled image
- Returns: A list of dictionaries. Each dictionary represents one cell/nucleus pair, with keys mapping to the average pixel value for that location. These cells do not need to be linked to an ID, as the test assigns each value to its closest neighbour in the true data.
Debugging
You may find that running
test_track_cells() without pytest gives a large number of deprecation warnings, presumably because of a mismatch between the documentation the LLM has looked up and the actual documentation.
These can be removed by modifying the keyword arguments in morphology.remove_small_objects and morphology.remove_small_holes in segment_cells() (min_size and area_threshold respectively) to both be max_size.Error 1, at timepoint 0 the number of cells is (n<80), not 80
What is the code doing before the error?
What sequence of operations are being performed before the error happens at timepoint 0 in
segment_cells() and track_cells_across_time()?What is causing the error?
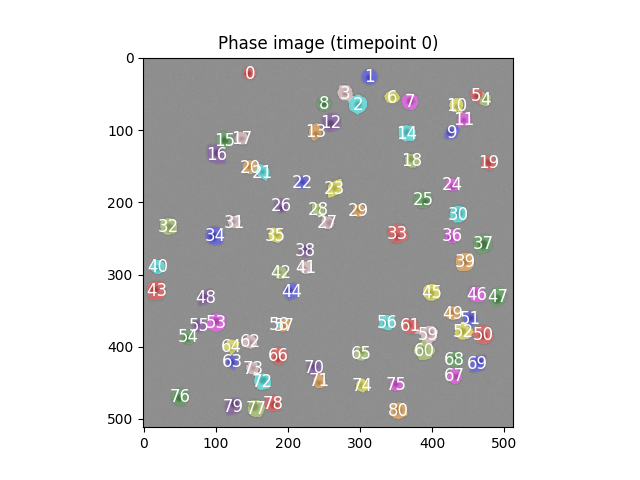
Modify the code to plot the segmented image, showing the
cell_id at each assigned cell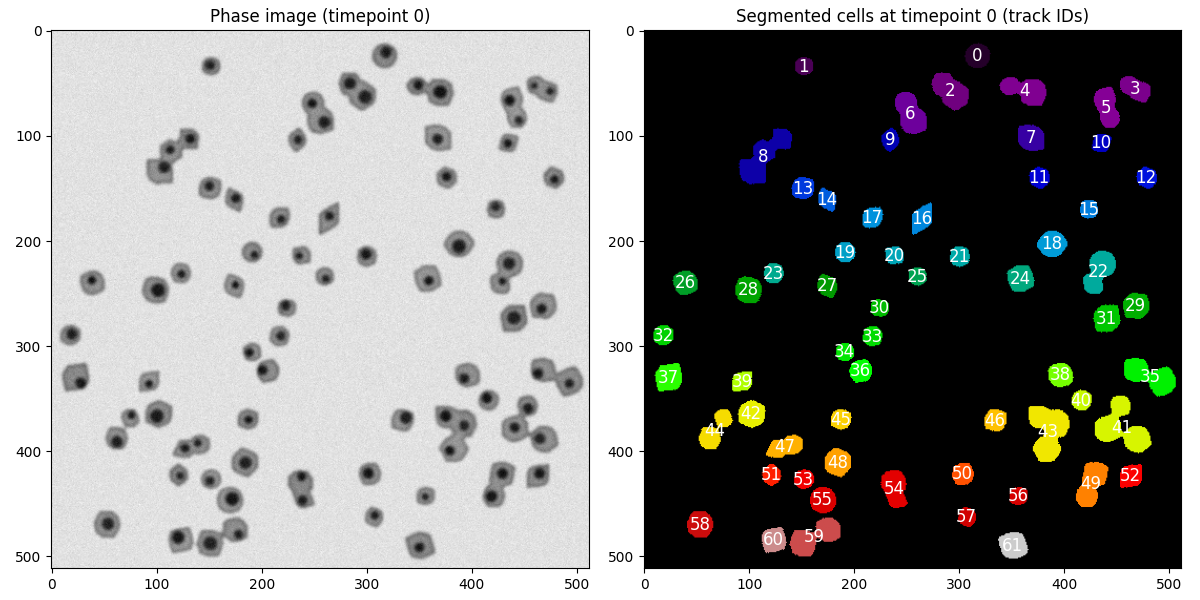
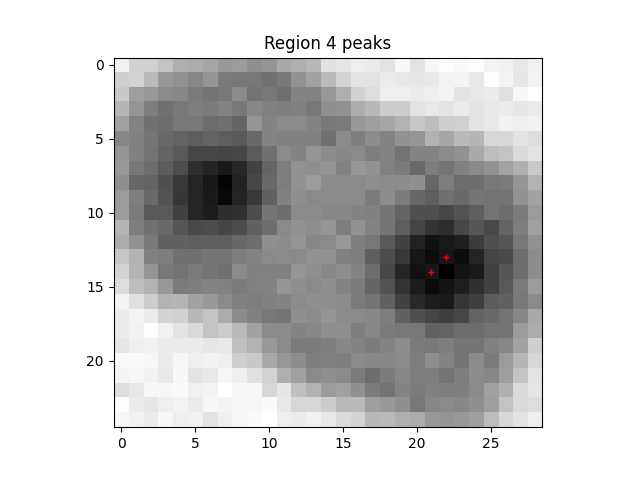
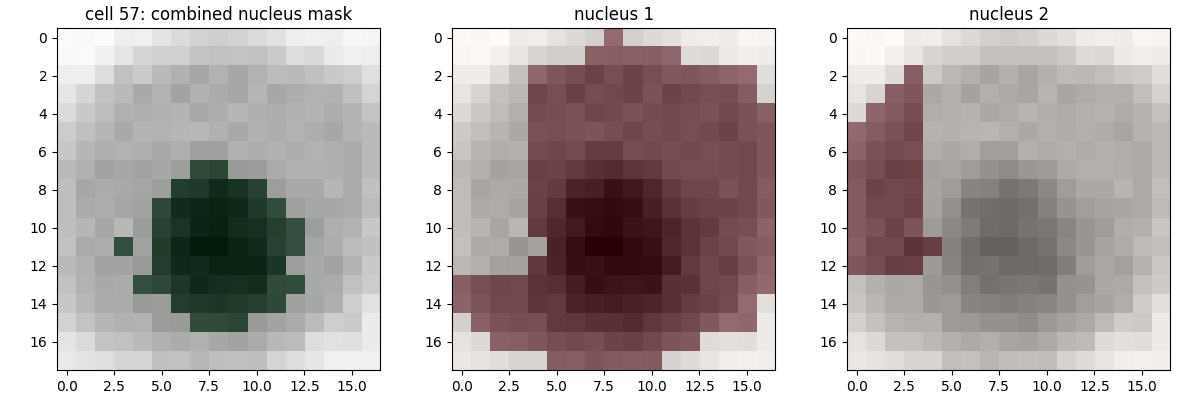
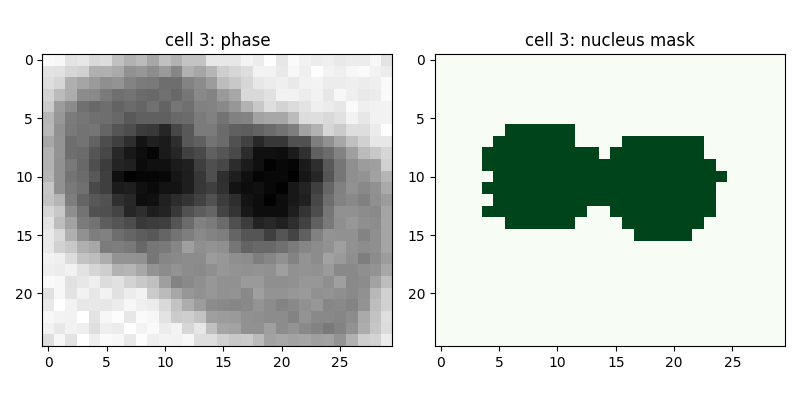
To resolve this we need two things: a way to count how many cells are in a merged region, and a way to draw boundaries between the cells once we know how many there are. You may find the skimage regionprops documentation and watershed example useful for the steps below.
How can we resolve the error?
Given the problem identified in the prior "diagnosis" section, identify what sequence of operations is required to obtain the desired behaviour.
Write some code to resolve the issue.
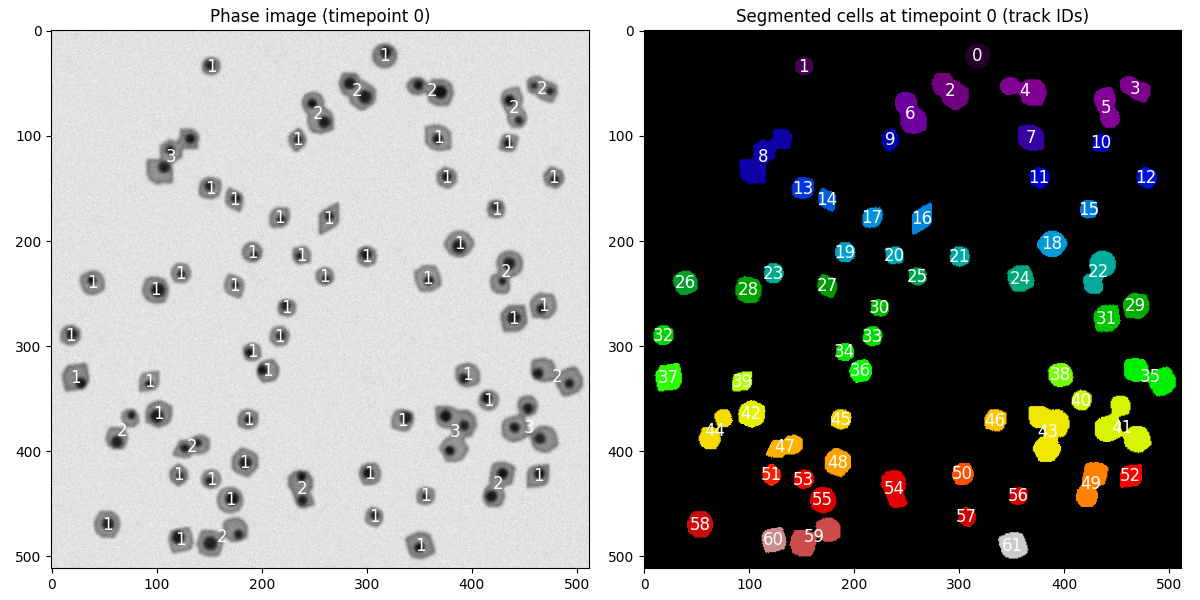
We know how many cells are in a merged region, and we've already identified where their nuclei are.
What information do we have that could help us draw a boundary between them? We can't use the same thresholding trick as before, as it isn't possible to distinguish merged cells based on colour.
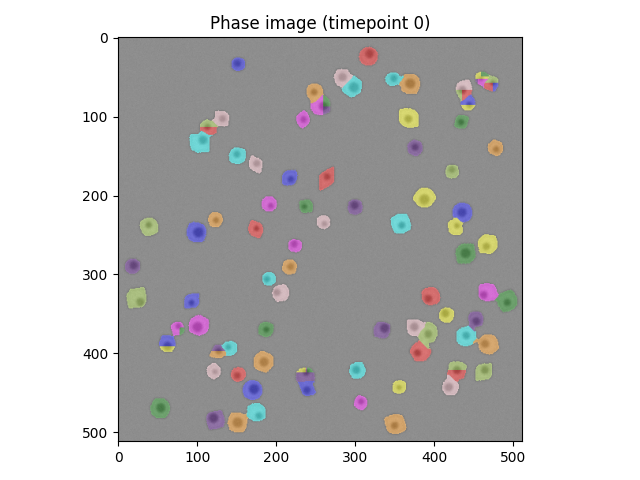
If you looked in the previous solution block, you'll see the initial watershed segmentation isn't great.
Let's try and diagnose the issue
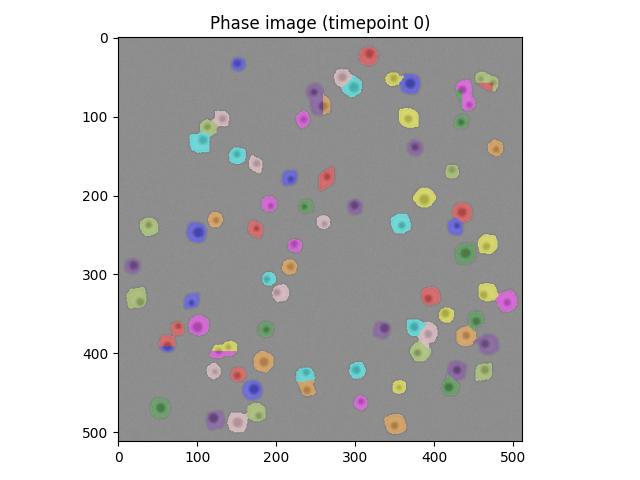
Up to this point in the solution blocks, we've got a sequence of steps that does at least some of the job of segmentation. We'll move the logic into
segment_cells(), and take the opportunity to create a new data structure cell_atlas, to make things easier to keep track of.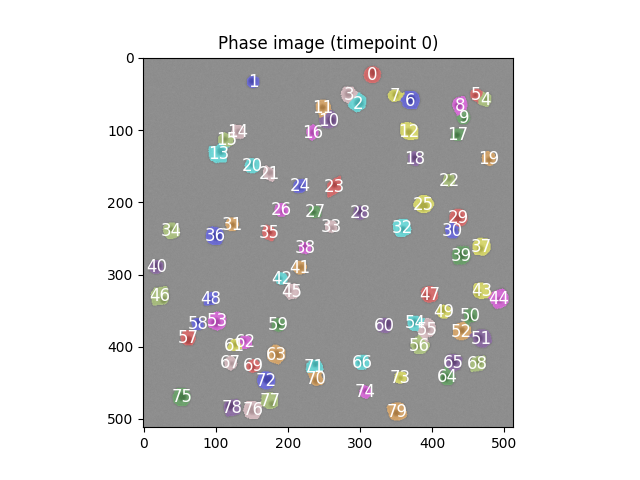
Error 2, at the first timepoint >0 cell centres have been assigned incorrectly
This error appears in some implementations and not others, depending on how centroids are calculated.
The diagnostic approach below is useful regardless of whether you encounter it.
The error arises because, even if 80 cells have been correctly segmented from the first phase image, the location of some of those cells is incompatible with the actual known truth.
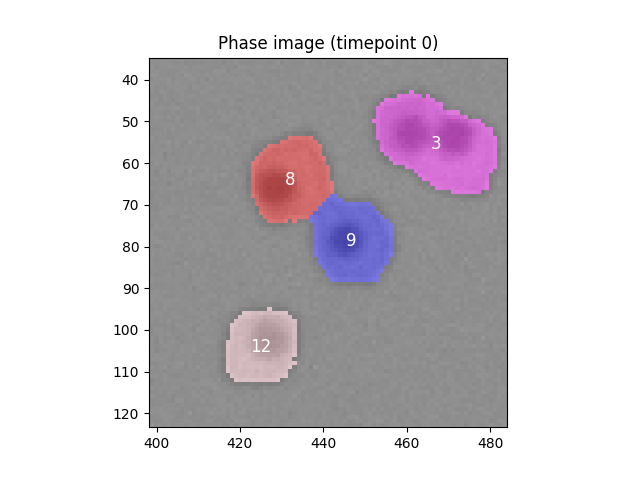
Looking at the figure from the last solution block again.
If you have your own implementation it's likely that the error is one of
- The segmentation code has produced 80 cells but they are improperly segmented
- Your calculation of the centre point is incorrect
- Your segmentation is completely wrong
What is causing the error?
Briefly modify the test code (i.e
test_track_cells()) to diagnose the error.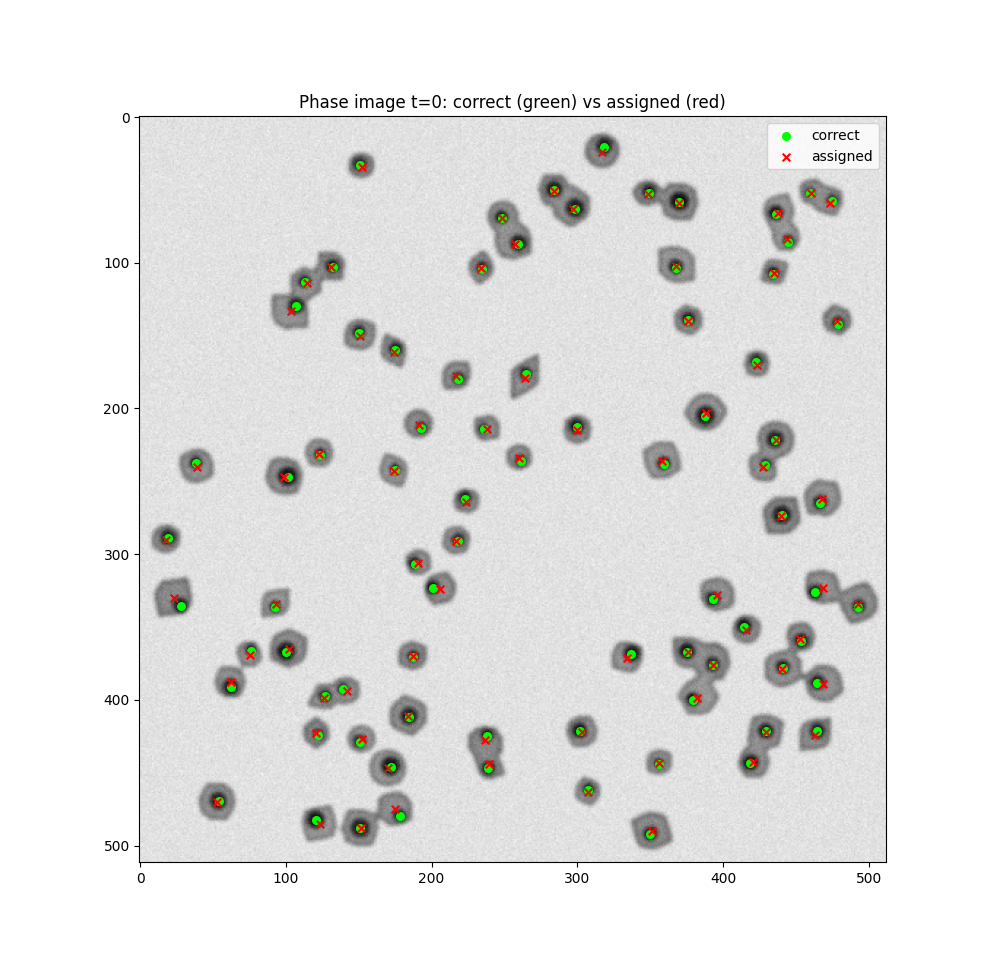
Error 3, at time t, cell_id N has been incorrectly assigned to true index X, expected true index Y
What is the code doing before the error?
How does the
track_cells_across_time() function track cells?Diagnosing the error
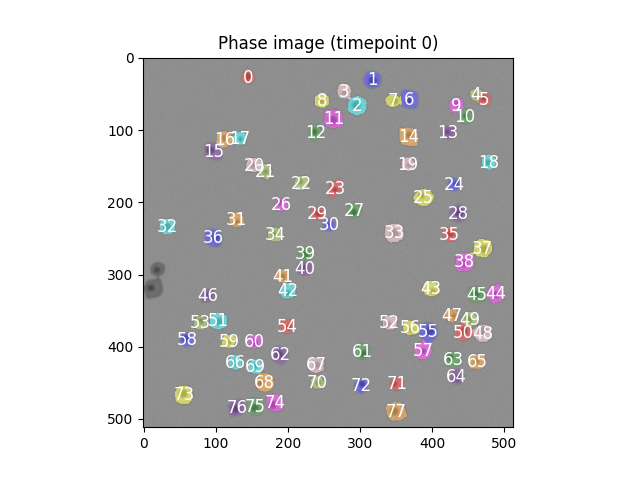
Briefly add some diagnostic plotting code to the test function to show the phase image and assigned cell_ids at time
t and time t-1 when the error is raisedHow can we resolve the error?
Personally I don't think the LLM solution to the tracking problem here is very good; using the cell segments and
regionprops seems to provide very poor assignments. Are there any other features you could use to check distances between timepoints? There are two insights you need to get the code working (for the t0->t1 case at least), both of which are in the following solution blockError 4, at timepoint t, fluorescence value extraction in cytoplasm/nuclear over distance threshold to true value (mean difference x, s.d. y)
So, we've successfully segmented the cells in t=0 and t=1, and have assigned the cells ids correctly, between t0 and t1. This error is about extracting the fluorescence value. The LLM implementation uses the labelled image, but, if you've been using the
cell_atlas approach (the rewrite as defined in the previous solution blocks), we have a bbox key and two mask keys to provide the location of each cell in each image. I would recommend very slightly re-writing the test function to pass a data structure like this, rather than the labelled image itself. Alternatively, you can write your code so that the nuclei and cytoplasmic regions are given separate labels.Diagnosing and fixing the error
Rewrite to use
cell_mask, etc. keys from the previous solution. If you're not using the cell_atlas approach, you'll need to at least pass two labelled images, one with cell masks and one with the nuclei masks.Modify
extract_nuclear_cytoplasmic() to check which sections of the intensity image are having their fluorescence values extracted.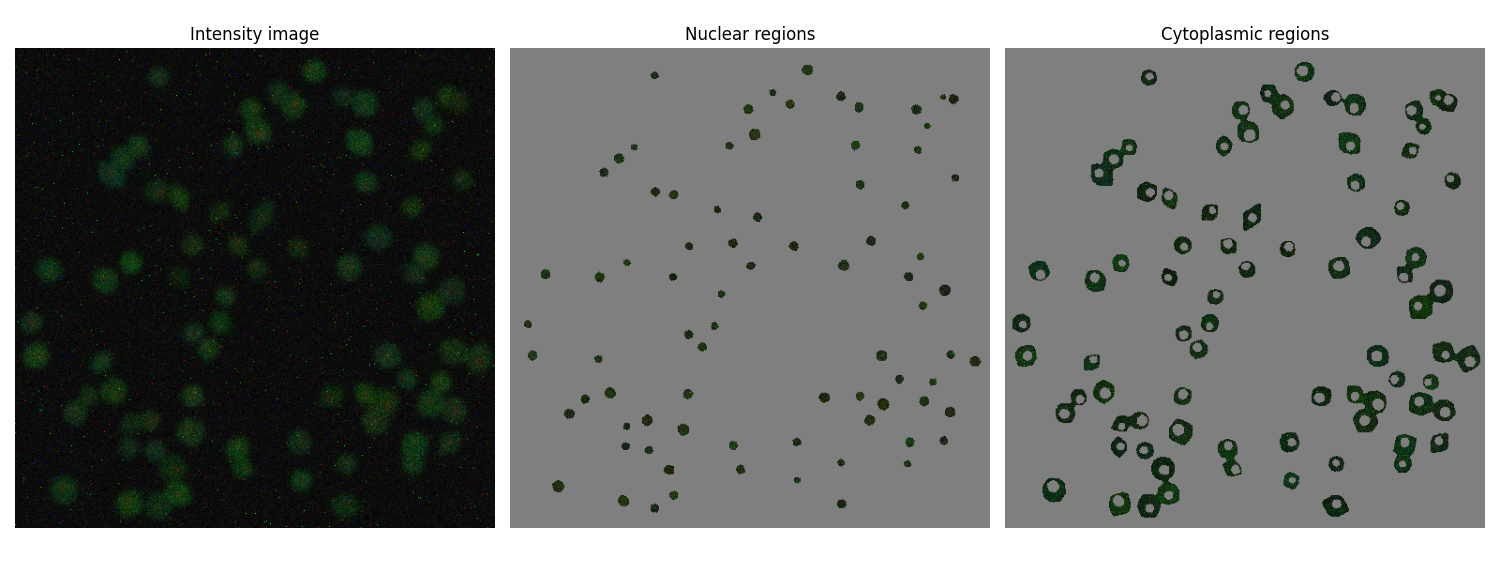
Really annoying LLM bug ahead:
Error 5 at timepoint t the number of cells in the segmented image is >80, not 80
We've gone the other way from the first error, and are now assigning too many cells rather than too few.
Diagnosing and fixing the error
As before, let's write some code to catch what's happening. This is occuring in the segmentation logic, so lets plot that first
Write some code to determine what is happening before this error.
Create a fix for the error
Error 6 at timepoint t the number of cells in the segmented image is <80, not 80
We're still having segmentation problems!
Diagnosing and fixing the error
Again, let's try and find which part of the segmentation code is breaking to cause this error. The initial diagnosis is identical to the previous solution:
if cell_id < 80: # Only want this to fire when too many nuceli have been found fig, ax_phase = plt.subplots() gray0 = phase_image phase_norm = gray0 / gray0.max() if gray0.max() > 0 else gray0 ax_phase.imshow(color.label2rgb(labeled, image=phase_norm, bg_label=0, alpha=0.4)) for entry in cell_atlas: min_row, min_col, max_row, max_col = entry["bbox"] ys, xs = np.where(entry["cell_mask"]) # Number goes in centre of bbox ax_phase.text( min_col + xs.mean(), min_row + ys.mean(), str(entry["cell_id"]), # Now using the ID from cell_atlas color="white", fontsize=12, ha="center", va="center", ) ax_phase.set_title("Phase image (timepoint 0)") plt.show()
What is the source of the error this time?
Write some code to fix these errors.
Error 1:
Diagnose the source of the second error
Write some code to catch this error
Wrapping up
Once you're satisfied that all tests pass:
python -m pytest fluorescence_extractor_test.py::test_track_cells
Remove any diagnostic code you added to
fluorescence_extractor_test.py, then merge your changes back into master:git checkout master git merge cell_tracking_fix