Calibration
Calibration
Fluorescence microscopy measures light intensity, but what we actually want to know is how many protein molecules are present in each cell.
A separate experiment has been run in which the fluorescence of known quantities of the relevant proteins were recorded, and we can use that data to build a conversion function.
Getting started
Navigate to
Repressilator_tests/tests and verify that the test fails:python -m pytest calibration_test.py::test_calibration
We're going to be making changes to the codebase, so it's worth making a separate branch first:
git checkout -b calibration_fix
Now we can make changes to the tests and
repressilator_analysis module, and can choose to merge them back later.
It's often worth being able to print test outputs, so you may like to add test_calibration() to the end of calibration_test.py.
You can then see the same test output by running:python calibration_test.py
A description of how the calibration experiments were conducted can be found in
docs/calibration_experiment_analysis.txt, along with the two {protein_name}_calibration.txt files.The test function
calibration.ProteinCalibration.pixel_intensities_to_molecules()- Arguments: A pixel value (or an average of a number of pixel values)
- Returns: The number of protein molecules
Debugging
AssertionError
assert np.mean(np.abs(calculated_molecules-true_amounts))<170What does the code do?
Examine
pixel_intensities_to_molecules() method and identify what transformations are made to go from pixel value to protein numbers.What is the source of the error?
We need to determine where has the sequence of transformations in steps 1-5 in the solution above gone wrong.
Plot the calibration data in the
docs/{protein_name}_calibration.txt files.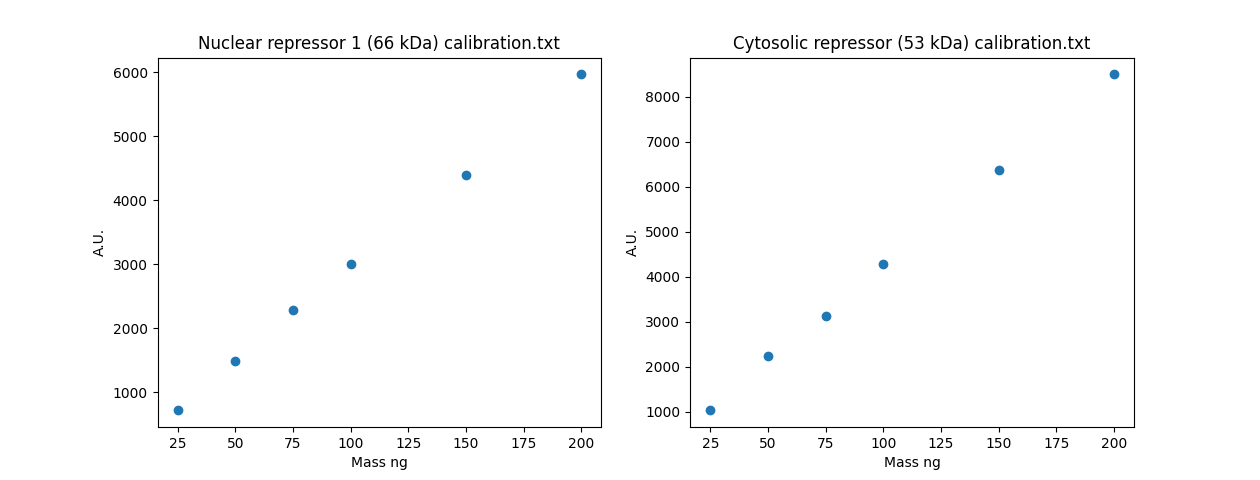 Looks pretty linear - it's a little surprising if you looked at the
 Having seen the calibration data is linear, calculate the value in nanograms for 2000 proteins, and the expected A.U. value, assuming this linear relationship holds.
Place this as a scatter point on the graph (the 2000 order of magnitdue comes from fig.1 in the Repressilator paper in the
/docs/ folder).
Also place the LLM A.U. estimate on the graph, and print the values of both estimates.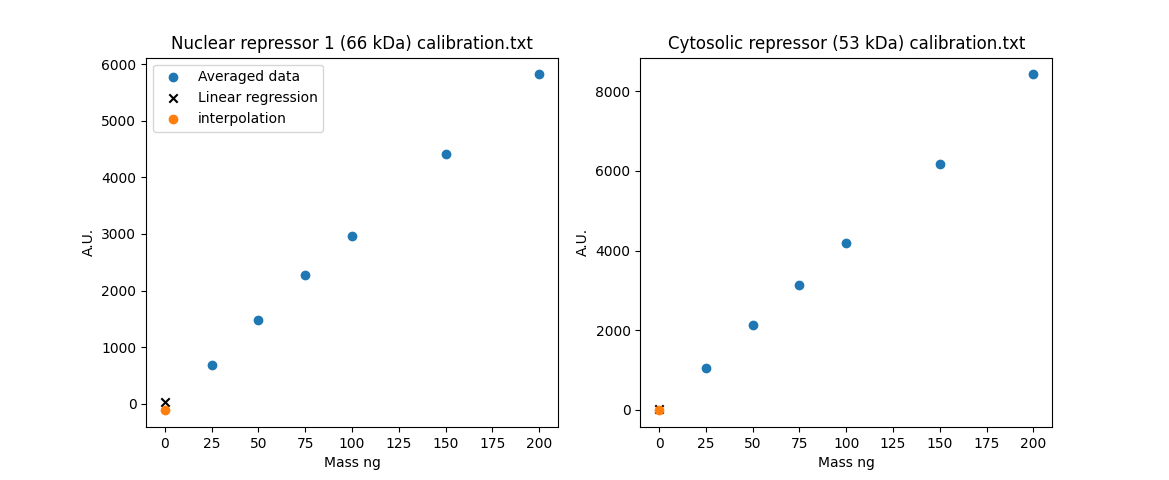
Fixing the Code
In the previous solution block, we determined that using interpolation at values far outside the interpolation range is unlikely to accurately capture the linear relationship between protein number and fluorescence.
Use an alternative approach, using the full dataset in the
docs/calibration files (rather than averaging them, as the LLM implementation does).Wrapping up
Once you're satisfied that all tests pass:
python -m pytest calibration_test.py::test_calibration
Remove any diagnostic code you added to
calibration_test.py, then merge your changes back into master:git checkout master git merge calibration_fix